 |
Matronics Email Lists
Web Forum Interface to the Matronics Email Lists
|
| View previous topic :: View next topic |
| Author |
Message |
cluros(at)gmail.com
Guest
|
 Posted: Sat Sep 23, 2017 3:11 pm Post subject: Voltmeter & Ammeter normal ranges Posted: Sat Sep 23, 2017 3:11 pm Post subject: Voltmeter & Ammeter normal ranges |
 |
|
I am doing the test flying on a friend's RV-6 and as part of the preparation I set up the engine monitor (Dynon 120) to display the following on the voltmeter and ammater:


Voltmeter: Red below 10V, Yellow 10-13.8V, Green 13.8V-14.5V, Red > 14.5V

Ammeter (wired to show current flow in to the batter): Red < 0A, Green 0 - 5A, Yellow 5-30A, Red > 30A.

Battery is an Odyssey PC680 AGM. Alternator and regulator unknown, came with the kit from Van's 10-20 years ago. My guess is Plane Power.

First Question: Do the ammeter settings seem reasonable? Obviously any discharge (<0A) is red as indicative of a problem that requires landing ASAP. Normal charge after a start has been observed to be < 5A within a minute after start, a hard start or low battery would obviously make this worse so I set green as 0-5A but don't have any good basis for this. Same for the yellow and red bands. I want the yellow band to indicate that a long time in this area is a problem, and red to be an immediate problem. Normally once the battery has been charged after a start the value should be zero so perhaps the green band should be 0-1A? What charge level going into this battery would indicate an immediate problem (red band)?

\

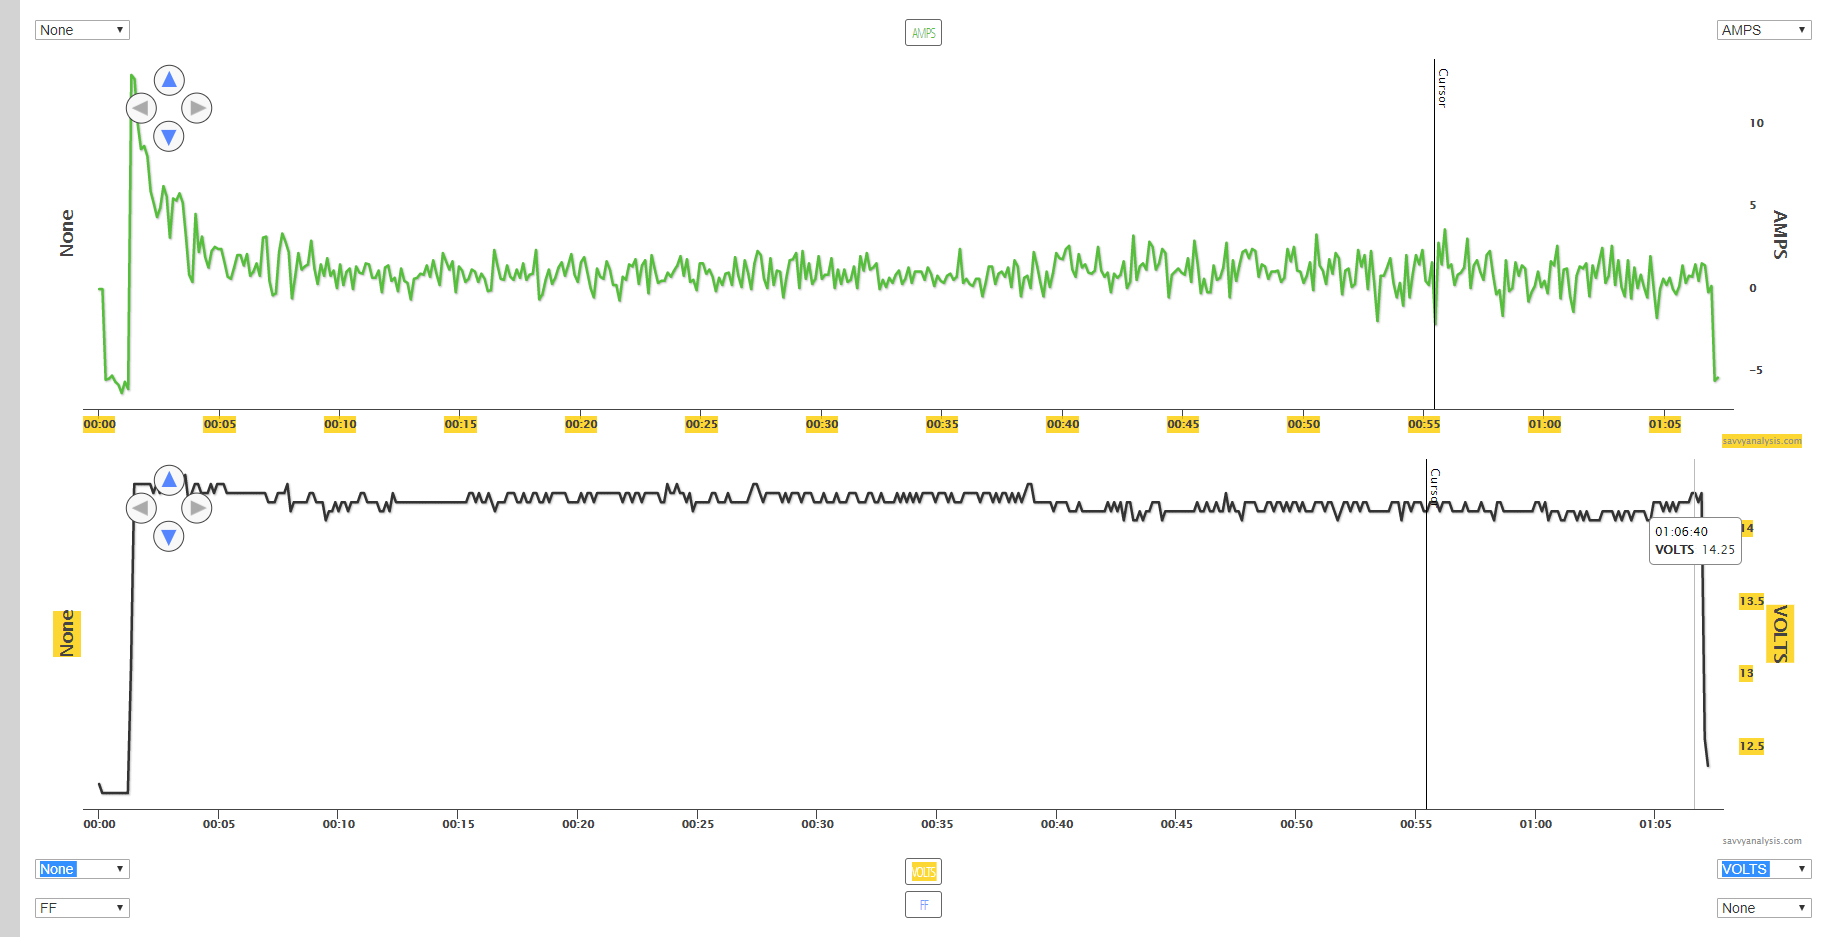
After first flight the low current alarm was constantly going off so I changed it from <0 to <1. Second flight had similar but not as frequent problem so I was going to lower it a little more but then I was able to download the engine monitor data to Savvy and WOW is it fantastic being able to look at graphs of engine data. I have no idea what normal would look like but here is a snap shot of the second flight:


You can see the battery amps wander between -2 to +2, with excursions to -3 +3 later in the flight (during large engine power changes).

Second Question: Is this behaviour indicative of:

A. Normal operation

B. Sensor problem

C. Charging system or battery problem

D. Something else

Thank you all for your input.
| | - The Matronics AeroElectric-List Email Forum - | | | Use the List Feature Navigator to browse the many List utilities available such as the Email Subscriptions page, Archive Search & Download, 7-Day Browse, Chat, FAQ, Photoshare, and much more:
http://www.matronics.com/Navigator?AeroElectric-List |
|
| Description: |
|
| Filesize: |
375.57 KB |
| Viewed: |
15595 Time(s) |
|
|
|
| Back to top |
|
 |
user9253
Joined: 28 Mar 2008
Posts: 1927
Location: Riley TWP Michigan
|
 Posted: Sat Sep 23, 2017 3:47 pm Post subject: Re: Voltmeter & Ammeter normal ranges Posted: Sat Sep 23, 2017 3:47 pm Post subject: Re: Voltmeter & Ammeter normal ranges |
 |
|
My D-180 ammeter varies up and down to unreasonable numbers.

I disconnected the shunt and put a jumper directly across the plus

and minus input on the D-180.  One would expect the D-180 to

display 0 amps.  But no, it still varies up and down, not as bad as

before, but still plus and minus 15 or 20 amps.  I believe it is a

software problem.  Maybe the Dynon 120 has the same problem.
| | - The Matronics AeroElectric-List Email Forum - | | | Use the List Feature Navigator to browse the many List utilities available such as the Email Subscriptions page, Archive Search & Download, 7-Day Browse, Chat, FAQ, Photoshare, and much more:
http://www.matronics.com/Navigator?AeroElectric-List |
|
_________________
Joe Gores |
|
| Back to top |
|
 |
ceengland7(at)gmail.com
Guest
|
 Posted: Sat Sep 23, 2017 4:13 pm Post subject: Voltmeter & Ammeter normal ranges Posted: Sat Sep 23, 2017 4:13 pm Post subject: Voltmeter & Ammeter normal ranges |
 |
|
On 9/23/2017 6:09 PM, Sebastien wrote:
| Quote: | I am doing the test flying on a friend's RV-6 and as part of the
preparation I set up the engine monitor (Dynon 120) to display the
following on the voltmeter and ammater:
Voltmeter: Red below 10V, Yellow 10-13.8V, Green 13.8V-14.5V, Red > 14.5V
Ammeter (wired to show current flow in to the batter): Red < 0A, Green
0 - 5A, Yellow 5-30A, Red > 30A.
Battery is an Odyssey PC680 AGM. Alternator and regulator unknown,
came with the kit from Van's 10-20 years ago. My guess is Plane Power.
First Question: Do the ammeter settings seem reasonable? Obviously any
discharge (<0A) is red as indicative of a problem that requires
landing ASAP. Normal charge after a start has been observed to be < 5A
within a minute after start, a hard start or low battery would
obviously make this worse so I set green as 0-5A but don't have any
good basis for this. Same for the yellow and red bands. I want the
yellow band to indicate that a long time in this area is a problem,
and red to be an immediate problem. Normally once the battery has been
charged after a start the value should be zero so perhaps the green
band should be 0-1A? What charge level going into this battery would
indicate an immediate problem (red band)?
\
After first flight the low current alarm was constantly going off so I
changed it from <0 to <1. Second flight had similar but not as
frequent problem so I was going to lower it a little more but then I
was able to download the engine monitor data to Savvy and WOW is it
fantastic being able to look at graphs of engine data. I have no idea
what normal would look like but here is a snap shot of the second flight:
You can see the battery amps wander between -2 to +2, with excursions
to -3 +3 later in the flight (during large engine power changes).
Second Question: Is this behaviour indicative of:
A. Normal operation
B. Sensor problem
C. Charging system or battery problem
D. Something else
Thank you all for your input.
Well, here's my 2 volts...
|
Current readings depend on where the sensor is located in the system.
Assuming it's between the battery lead & the bus, it will show charge
for at least a short time after engine start, to replenish the battery.
After that, it should show more or less zero (with some slight
variation) because the alternator has fully charged the battery (no more
electrons flowing into the battery) and is supplying all the electron
needs of the avionics, etc. It would show discharge whenever the
alternator couldn't keep up with the load demands of the a/c, and the
battery started picking up the balance of the demand. (Shouldn't happen
unless you've intentionally undersized the alternator to save weight,
and are willing to accept temporary discharge during very short term
events like landing lights, gear extension/retraction, etc.) Other time
you'd see it is if the charging system is failing or has failed.
But I don't even have an ammeter on my current plane, & don't plan to
install one in the plane I'm building. Alternator voltage gives all info
needed during flight.
Voltage: At 10 volts, the battery is effectively dead, and you might not
see *any* indication from the EFIS engine monitor (or from the EFIS
itself). If I were setting limits, I'd realize that anything under
around 12.5 volts means the charging system is effectively dead (red).
I'd probably set the red limit even higher; around 13.5, because I'd
want to know instantly that I've lost charging. I'd only see the yellow
band as useful to show intermittent excess demand situations, where it
would go in & out of yellow as really big loads were exceeding the
alternator's capacity. So yellow from around 13.5 to just under that
particular alternator's 'normal' output voltage, which hopefully, is
over 14.3 or so to keep the AGM battery fully charged. Red again above
about 14.8 or so, since Odyssey says 14.7 is a safe level of initial
charge voltage.
Hope its at least worth what you paid...
Charlie
---
This email has been checked for viruses by Avast antivirus software.
https://www.avast.com/antivirus
| | - The Matronics AeroElectric-List Email Forum - | | | Use the List Feature Navigator to browse the many List utilities available such as the Email Subscriptions page, Archive Search & Download, 7-Day Browse, Chat, FAQ, Photoshare, and much more:
http://www.matronics.com/Navigator?AeroElectric-List |
|
|
|
| Back to top |
|
 |
cluros(at)gmail.com
Guest
|
 Posted: Sat Sep 23, 2017 6:01 pm Post subject: Voltmeter & Ammeter normal ranges Posted: Sat Sep 23, 2017 6:01 pm Post subject: Voltmeter & Ammeter normal ranges |
 |
|
Very interesting Joe, thanks for the reply. Did you try upgrading the firmware? Did you follow up with Dynon about this behaviour? In view of your experience I think I'll give them a call on Monday.
Sebastien
| Quote: | On Sep 24, 2017, at 01:47, user9253 <fransew(at)gmail.com> wrote:
My D-180 ammeter varies up and down to unreasonable numbers. I disconnected the shunt and put a jumper directly across the plus and minus input on the D-180. One would expect the D-180 to display 0 amps. But no, it still varies up and down, not as bad as before, but still plus and minus 15 or 20 amps. I believe it is a software problem. Maybe the Dynon 120 has the same problem.
--------
Joe Gores
Read this topic online here:
http://forums.matronics.com/viewtopic.php?p=473105#473105
|
| | - The Matronics AeroElectric-List Email Forum - | | | Use the List Feature Navigator to browse the many List utilities available such as the Email Subscriptions page, Archive Search & Download, 7-Day Browse, Chat, FAQ, Photoshare, and much more:
http://www.matronics.com/Navigator?AeroElectric-List |
|
|
|
| Back to top |
|
 |
user9253
Joined: 28 Mar 2008
Posts: 1927
Location: Riley TWP Michigan
|
 Posted: Sat Sep 23, 2017 6:16 pm Post subject: Re: Voltmeter & Ammeter normal ranges Posted: Sat Sep 23, 2017 6:16 pm Post subject: Re: Voltmeter & Ammeter normal ranges |
 |
|
Yes, the D-180 firmware is up to date. No, I did not contact Dynon. The ammeter function is not important to me. I agree with Charlie, the voltmeter tells me how the charging system is working.
| | - The Matronics AeroElectric-List Email Forum - | | | Use the List Feature Navigator to browse the many List utilities available such as the Email Subscriptions page, Archive Search & Download, 7-Day Browse, Chat, FAQ, Photoshare, and much more:
http://www.matronics.com/Navigator?AeroElectric-List |
|
_________________
Joe Gores |
|
| Back to top |
|
 |
ashleysc(at)broadstripe.n
Guest
|
 Posted: Sat Sep 23, 2017 6:52 pm Post subject: Voltmeter & Ammeter normal ranges Posted: Sat Sep 23, 2017 6:52 pm Post subject: Voltmeter & Ammeter normal ranges |
 |
|
Hi Sebastien;


Flow out of the battery is not abnormal and will happen whenever your aircraft consumes more power than its alternator can generate. It is not generally a signal to land immediately, but to reduce power consumption (like turn off the landing lights).

Cheers!   Stu.

From: "Sebastien" <cluros(at)gmail.com>

To: aeroelectric-list(at)matronics.com

Sent: Saturday, September 23, 2017 4:09:48 PM

Subject: Voltmeter & Ammeter normal ranges

I am doing the test flying on a friend's RV-6 and as part of the preparation I set up the engine monitor (Dynon 120) to display the following on the voltmeter and ammater:


Voltmeter: Red below 10V, Yellow 10-13.8V, Green 13.8V-14.5V, Red > 14.5V

Ammeter (wired to show current flow in to the batter): Red < 0A, Green 0 - 5A, Yellow 5-30A, Red > 30A.

Battery is an Odyssey PC680 AGM. Alternator and regulator unknown, came with the kit from Van's 10-20 years ago. My guess is Plane Power.

First Question: Do the ammeter settings seem reasonable? Obviously any discharge (<0A) is red as indicative of a problem that requires landing ASAP. Normal charge after a start has been observed to be < 5A within a minute after start, a hard start or low battery would obviously make this worse so I set green as 0-5A but don't have any good basis for this. Same for the yellow and red bands. I want the yellow band to indicate that a long time in this area is a problem, and red to be an immediate problem. Normally once the battery has been charged after a start the value should be zero so perhaps the green band should be 0-1A? What charge level going into this battery would indicate an immediate problem (red band)?

\

After first flight the low current alarm was constantly going off so I changed it from <0 to <1. Second flight had similar but not as frequent problem so I was going to lower it a little more but then I was able to download the engine monitor data to Savvy and WOW is it fantastic being able to look at graphs of engine data. I have no idea what normal would look like but here is a snap shot of the second flight:


You can see the battery amps wander between -2 to +2, with excursions to -3 +3 later in the flight (during large engine power changes).

Second Question: Is this behaviour indicative of:

A. Normal operation

B. Sensor problem

C. Charging system or battery problem

D. Something else

Thank you all for your input.
| | - The Matronics AeroElectric-List Email Forum - | | | Use the List Feature Navigator to browse the many List utilities available such as the Email Subscriptions page, Archive Search & Download, 7-Day Browse, Chat, FAQ, Photoshare, and much more:
http://www.matronics.com/Navigator?AeroElectric-List |
|
|
|
| Back to top |
|
 |
cluros(at)gmail.com
Guest
|
 Posted: Sat Sep 23, 2017 8:25 pm Post subject: Voltmeter & Ammeter normal ranges Posted: Sat Sep 23, 2017 8:25 pm Post subject: Voltmeter & Ammeter normal ranges |
 |
|
I'm guessing from some of the responses I'm getting that the picture I attached did not go through. The apparent current flow out of the battery is not from a high load. We're talking a 40-60 amp alternator powering 10 amps worth of instruments and radios. The load cycles from -2 to +2 amps at least 50 times over the course of a 1 hour flight and it's not because someone's hiding under the floorboards flicking the lights on and off  . .
I'll try attaching the engine analyzer data again tomorrow. I did manage to check a few minutes of data from an identical analyzer in a different aircraft and while it did cycle up and down a bit, it never showed negative.
Sebastien
On Sep 24, 2017, at 04:50, ashleysc(at)broadstripe.net (ashleysc(at)broadstripe.net) wrote:
| Quote: | Hi Sebastien;
Flow out of the battery is not abnormal and will happen whenever your aircraft consumes more power than its alternator can generate. It is not generally a signal to land immediately, but to reduce power consumption (like turn off the landing lights).
Cheers! Stu.
From: "Sebastien" <cluros(at)gmail.com (cluros(at)gmail.com)>
To: aeroelectric-list(at)matronics.com (aeroelectric-list(at)matronics.com)
Sent: Saturday, September 23, 2017 4:09:48 PM
Subject: Voltmeter & Ammeter normal ranges
I am doing the test flying on a friend's RV-6 and as part of the preparation I set up the engine monitor (Dynon 120) to display the following on the voltmeter and ammater:
Voltmeter: Red below 10V, Yellow 10-13.8V, Green 13.8V-14.5V, Red > 14.5V
Ammeter (wired to show current flow in to the batter): Red < 0A, Green 0 - 5A, Yellow 5-30A, Red > 30A.
Battery is an Odyssey PC680 AGM. Alternator and regulator unknown, came with the kit from Van's 10-20 years ago. My guess is Plane Power.
First Question: Do the ammeter settings seem reasonable? Obviously any discharge (<0A) is red as indicative of a problem that requires landing ASAP. Normal charge after a start has been observed to be < 5A within a minute after start, a hard start or low battery would obviously make this worse so I set green as 0-5A but don't have any good basis for this. Same for the yellow and red bands. I want the yellow band to indicate that a long time in this area is a problem, and red to be an immediate problem. Normally once the battery has been charged after a start the value should be zero so perhaps the green band should be 0-1A? What charge level going into this battery would indicate an immediate problem (red band)?
\
After first flight the low current alarm was constantly going off so I changed it from <0 to <1. Second flight had similar but not as frequent problem so I was going to lower it a little more but then I was able to download the engine monitor data to Savvy and WOW is it fantastic being able to look at graphs of engine data. I have no idea what normal would look like but here is a snap shot of the second flight:
You can see the battery amps wander between -2 to +2, with excursions to -3 +3 later in the flight (during large engine power changes).
Second Question: Is this behaviour indicative of:
A. Normal operation
B. Sensor problem
C. Charging system or battery problem
D. Something else
Thank you all for your input.
|
| | - The Matronics AeroElectric-List Email Forum - | | | Use the List Feature Navigator to browse the many List utilities available such as the Email Subscriptions page, Archive Search & Download, 7-Day Browse, Chat, FAQ, Photoshare, and much more:
http://www.matronics.com/Navigator?AeroElectric-List |
|
|
|
| Back to top |
|
 |
andymeyer
Joined: 31 Mar 2015
Posts: 54
Location: SW MI
|
 Posted: Sun Sep 24, 2017 1:34 am Post subject: Re: Voltmeter & Ammeter normal ranges Posted: Sun Sep 24, 2017 1:34 am Post subject: Re: Voltmeter & Ammeter normal ranges |
 |
|
Are your lines to/from the shunt twisted pair? If not, you may be getting loop current from elsewhere in the system. Not sure how much, but worth a check.
| | - The Matronics AeroElectric-List Email Forum - | | | Use the List Feature Navigator to browse the many List utilities available such as the Email Subscriptions page, Archive Search & Download, 7-Day Browse, Chat, FAQ, Photoshare, and much more:
http://www.matronics.com/Navigator?AeroElectric-List |
|
|
|
| Back to top |
|
 |
cluros(at)gmail.com
Guest
|
 Posted: Sun Sep 24, 2017 4:38 am Post subject: Voltmeter & Ammeter normal ranges Posted: Sun Sep 24, 2017 4:38 am Post subject: Voltmeter & Ammeter normal ranges |
 |
|
They aren't my lines but I'll check  . I'm also going through the install manual for the 120 and looking for documentation on the alternator and voltage regulator. Thanks for the idea Andy. . I'm also going through the install manual for the 120 and looking for documentation on the alternator and voltage regulator. Thanks for the idea Andy.
Sebastien
| Quote: | On Sep 24, 2017, at 11:34, andymeyer <ameyer(at)mil-amax.com> wrote:
Are your lines to/from the shunt twisted pair? If not, you may be getting loop current from elsewhere in the system. Not sure how much, but worth a check.
Read this topic online here:
http://forums.matronics.com/viewtopic.php?p=473114#473114
|
| | - The Matronics AeroElectric-List Email Forum - | | | Use the List Feature Navigator to browse the many List utilities available such as the Email Subscriptions page, Archive Search & Download, 7-Day Browse, Chat, FAQ, Photoshare, and much more:
http://www.matronics.com/Navigator?AeroElectric-List |
|
|
|
| Back to top |
|
 |
user9253
Joined: 28 Mar 2008
Posts: 1927
Location: Riley TWP Michigan
|
 Posted: Sun Sep 24, 2017 4:54 am Post subject: Re: Voltmeter & Ammeter normal ranges Posted: Sun Sep 24, 2017 4:54 am Post subject: Re: Voltmeter & Ammeter normal ranges |
 |
|
As long as system voltage is above 13, it is impossible for current to flow out of the battery.
| | - The Matronics AeroElectric-List Email Forum - | | | Use the List Feature Navigator to browse the many List utilities available such as the Email Subscriptions page, Archive Search & Download, 7-Day Browse, Chat, FAQ, Photoshare, and much more:
http://www.matronics.com/Navigator?AeroElectric-List |
|
_________________
Joe Gores |
|
| Back to top |
|
 |
ceengland7(at)gmail.com
Guest
|
 Posted: Sun Sep 24, 2017 5:28 am Post subject: Voltmeter & Ammeter normal ranges Posted: Sun Sep 24, 2017 5:28 am Post subject: Voltmeter & Ammeter normal ranges |
 |
|
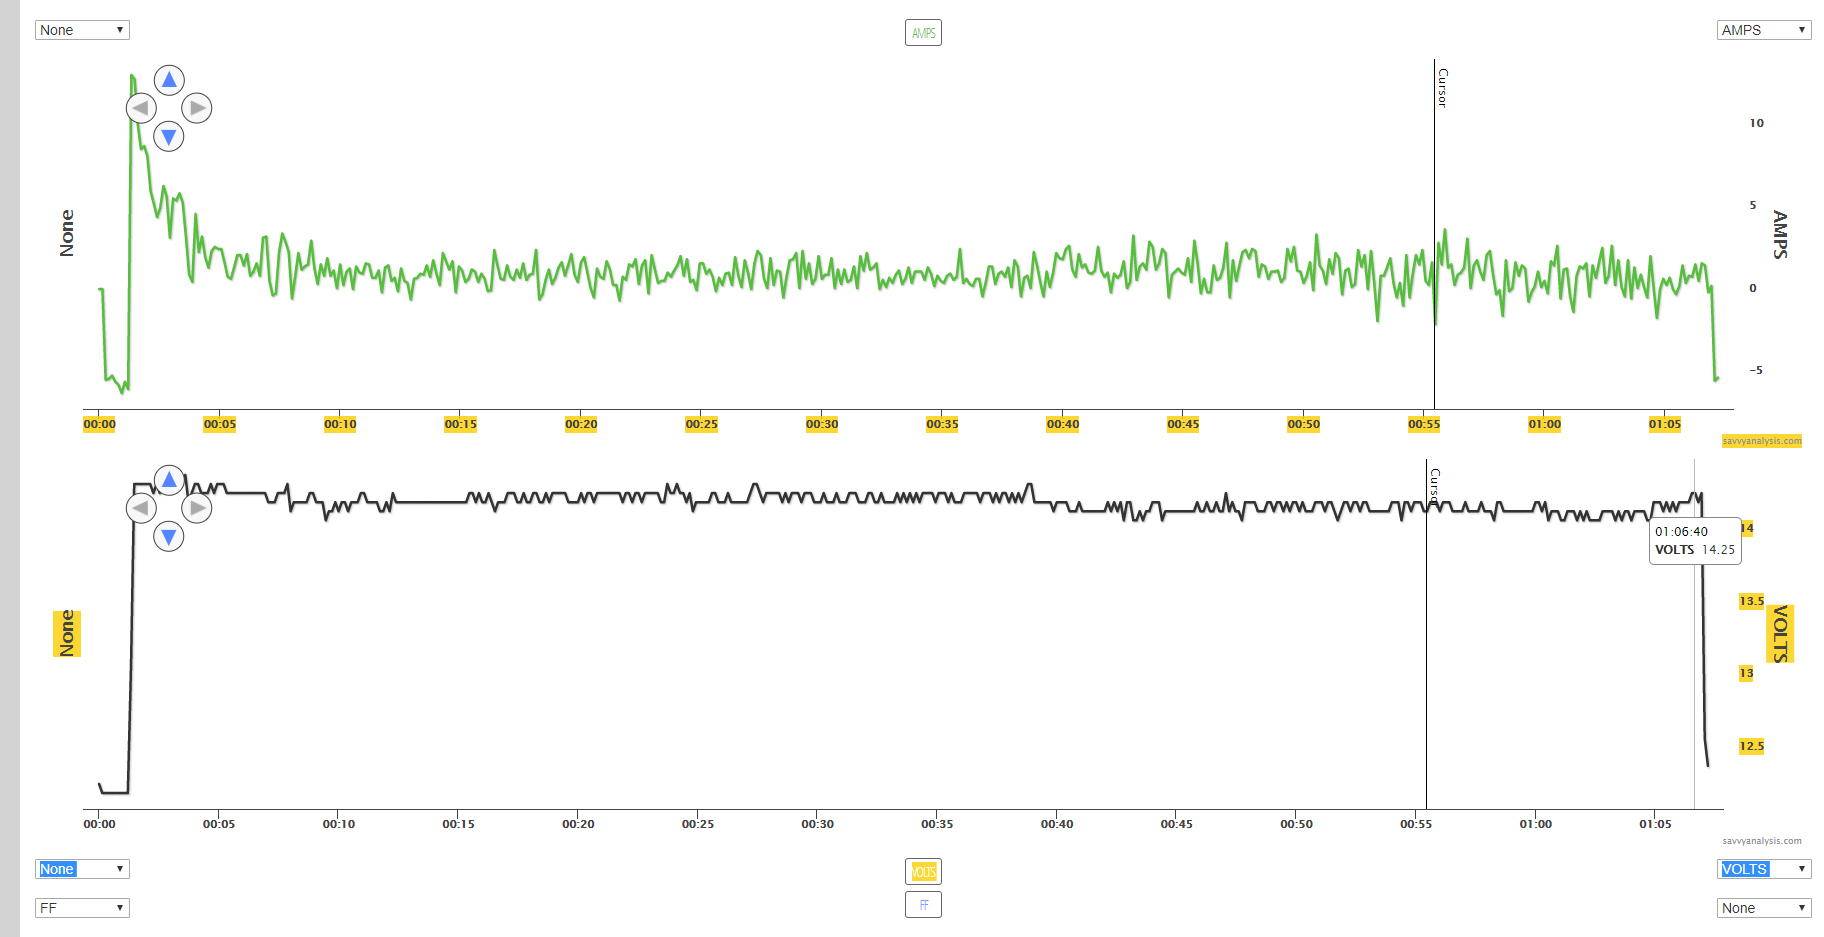
I did get the pic, but honestly didn't pay any attention to it. Just took a look. Note that voltage never drops below 14V. So the charging system is working great. My personal opinion is that you have too much of the wrong information, and not enough needed information.
Where is the shunt wired into the system?
Is it really a shunt, or a hall effect sensor?
What does the current do with *all loads except the battery removed*? (Yeah, I know you can't do that since the monitor is embedded in the EFIS.) How about with everything turned off except the EFIS/monitor?
A typical shunt has, IIRC, a 50 millivolt full scale output to the meter. Assuming it's a 60A shunt the output at the currents you're measuring would be wandering around a few thousandths of a volt. That is a very small signal, and as others have hinted, relatively easy to impress noise onto the lines. And the most minute variations in resistance of any connection anywhere in the sense circuit could cause large variations in voltage at the meter.
I seriously doubt that there's anything wrong with the charging system. There *may* be issues with the sensor and/or its wiring, but if it were my plane, I'd almost feel like I was getting too much knowledge for my own good. 
On Sat, Sep 23, 2017 at 11:14 PM, Sebastien <cluros(at)gmail.com (cluros(at)gmail.com)> wrote:
| Quote: | I'm guessing from some of the responses I'm getting that the picture I attached did not go through. The apparent current flow out of the battery is not from a high load. We're talking a 40-60 amp alternator powering 10 amps worth of instruments and radios. The load cycles from -2 to +2 amps at least 50 times over the course of a 1 hour flight and it's not because someone's hiding under the floorboards flicking the lights on and off  . .
I'll try attaching the engine analyzer data again tomorrow. I did manage to check a few minutes of data from an identical analyzer in a different aircraft and while it did cycle up and down a bit, it never showed negative.
Sebastien
On Sep 24, 2017, at 04:50, ashleysc(at)broadstripe.net (ashleysc(at)broadstripe.net) wrote:
| Quote: | Hi Sebastien;
Flow out of the battery is not abnormal and will happen whenever your aircraft consumes more power than its alternator can generate. It is not generally a signal to land immediately, but to reduce power consumption (like turn off the landing lights).
Cheers! Stu.
From: "Sebastien" <cluros(at)gmail.com (cluros(at)gmail.com)>
To: aeroelectric-list(at)matronics.com (aeroelectric-list(at)matronics.com)
Sent: Saturday, September 23, 2017 4:09:48 PM
Subject: Voltmeter & Ammeter normal ranges
I am doing the test flying on a friend's RV-6 and as part of the preparation I set up the engine monitor (Dynon 120) to display the following on the voltmeter and ammater:
Voltmeter: Red below 10V, Yellow 10-13.8V, Green 13.8V-14.5V, Red > 14.5V
Ammeter (wired to show current flow in to the batter): Red < 0A, Green 0 - 5A, Yellow 5-30A, Red > 30A.
Battery is an Odyssey PC680 AGM. Alternator and regulator unknown, came with the kit from Van's 10-20 years ago. My guess is Plane Power.
First Question: Do the ammeter settings seem reasonable? Obviously any discharge (<0A) is red as indicative of a problem that requires landing ASAP. Normal charge after a start has been observed to be < 5A within a minute after start, a hard start or low battery would obviously make this worse so I set green as 0-5A but don't have any good basis for this. Same for the yellow and red bands. I want the yellow band to indicate that a long time in this area is a problem, and red to be an immediate problem. Normally once the battery has been charged after a start the value should be zero so perhaps the green band should be 0-1A? What charge level going into this battery would indicate an immediate problem (red band)?
\
After first flight the low current alarm was constantly going off so I changed it from <0 to <1. Second flight had similar but not as frequent problem so I was going to lower it a little more but then I was able to download the engine monitor data to Savvy and WOW is it fantastic being able to look at graphs of engine data. I have no idea what normal would look like but here is a snap shot of the second flight:
You can see the battery amps wander between -2 to +2, with excursions to -3 +3 later in the flight (during large engine power changes).
Second Question: Is this behaviour indicative of:
A. Normal operation
B. Sensor problem
C. Charging system or battery problem
D. Something else
Thank you all for your input.
|
|
| | - The Matronics AeroElectric-List Email Forum - | | | Use the List Feature Navigator to browse the many List utilities available such as the Email Subscriptions page, Archive Search & Download, 7-Day Browse, Chat, FAQ, Photoshare, and much more:
http://www.matronics.com/Navigator?AeroElectric-List |
|
|
|
| Back to top |
|
 |
cluros(at)gmail.com
Guest
|
 Posted: Sun Sep 24, 2017 5:36 am Post subject: Voltmeter & Ammeter normal ranges Posted: Sun Sep 24, 2017 5:36 am Post subject: Voltmeter & Ammeter normal ranges |
 |
|
Exactly. Joe could you please confirm that the jpeg below is visible? If so it's obvious that while the voltage seems to be moving around a tiny bit, it never gets to the point which would allow the amperage shown. It's always above 14V. Also I checked some data with the engine shut down and while the amperage still wanders around it's 1 A or less (-5.5 to -6.5 A)
On Sun, Sep 24, 2017 at 5:54 AM, user9253 <fransew(at)gmail.com (fransew(at)gmail.com)> wrote:
| Quote: | --> AeroElectric-List message posted by: "user9253" <fransew(at)gmail.com (fransew(at)gmail.com)>
As long as system voltage is above 13, it is impossible for current to flow out of the battery.
--------
Joe Gores
Read this topic online here:
http://forums.matronics.com/viewtopic.php?p=473122#473122
====================================
-
Electric-List" rel="noreferrer" target="_blank">http://www.matronics.com/Navigator?AeroElectric-List
====================================
FORUMS -
eferrer" target="_blank">http://forums.matronics.com
====================================
WIKI -
errer" target="_blank">http://wiki.matronics.com
====================================
b Site -
-Matt Dralle, List Admin.
rel="noreferrer" target="_blank">http://www.matronics.com/contribution
====================================
|
| | - The Matronics AeroElectric-List Email Forum - | | | Use the List Feature Navigator to browse the many List utilities available such as the Email Subscriptions page, Archive Search & Download, 7-Day Browse, Chat, FAQ, Photoshare, and much more:
http://www.matronics.com/Navigator?AeroElectric-List |
|
| Description: |
|
| Filesize: |
375.57 KB |
| Viewed: |
15552 Time(s) |
|
|
|
| Back to top |
|
 |
nuckolls.bob(at)aeroelect
Guest
|
 Posted: Sun Sep 24, 2017 5:59 am Post subject: Voltmeter & Ammeter normal ranges Posted: Sun Sep 24, 2017 5:59 am Post subject: Voltmeter & Ammeter normal ranges |
 |
|
At 06:09 PM 9/23/2017, you wrote:
| Quote: | I am doing the test flying on a friend's RV-6 and as part of the preparation I set up the engine monitor (Dynon 120) to display the following on the voltmeter and ammater:
Voltmeter: Red below 10V, Yellow 10-13.8V, Green 13.8V-14.5V, Red > 14.5V
Ammeter (wired to show current flow in to the batter): Red < 0A, Green 0 - 5A, Yellow 5-30A, Red > 30A. |
Assuming you do monitor bus voltage and have
active notification of low voltage, then there
is no operational value for monitoring battery
current.
Battery ammeters in airplanes were a carry-over
from the terrestrial vehicles where the minus-zero-plus
instrument in the battery charge/discharge line
was the simplest single monitor of system health
during normal vehicle operations.
The ammeter would be expected to show a heavy
recharge rate right after cranking the engine . . .
or after a jumper cable start on a dead battery.
After some interval of normal operation, the battery
accepts less and less recharge energy and the needle
migrates toward zero. Under normal ops (votlage about
right, battery charged) the needle would rest at or
just slightly above zero.
If generator output was insufficient (low engine rpm,
high system loads, regulator voltage drifting downward,
generator failing) the needle would present some
value below zero.
While truly an analog instrument, its BEHAVIOR was
closer to 'digital' in that it was never intended to
be READ so much as observed as a go/no-go panel
instrument.
Ammeters of all types are of little to no value as sources of
operational data in flight. Ammeters in the battery
lead are pretty much useless when compared to an accurate
voltmeter paired with active notification of low
voltage.
Calibrating a battery ammeter with alarm settings
will be an exercise in futility.
Suggest you move the ammeter sensor to the alternator
b-lead and eliminate any alarm functions from this
reading. The ammeter is most useful as a maintenance
tool for diagnosing why the VOLTAGE is low and/or
the LOW VOLTS warning light was illuminated in the
air.
Bob . . .
| | - The Matronics AeroElectric-List Email Forum - | | | Use the List Feature Navigator to browse the many List utilities available such as the Email Subscriptions page, Archive Search & Download, 7-Day Browse, Chat, FAQ, Photoshare, and much more:
http://www.matronics.com/Navigator?AeroElectric-List |
|
|
|
| Back to top |
|
 |
cluros(at)gmail.com
Guest
|
 Posted: Tue Sep 26, 2017 7:18 pm Post subject: Voltmeter & Ammeter normal ranges Posted: Tue Sep 26, 2017 7:18 pm Post subject: Voltmeter & Ammeter normal ranges |
 |
|
Thank you all for your input. I've eliminated the warning function and changed the ammeter band to green only. No more annoying warnings! Well, we still have very high CHT warnings but we have a plan to deal with that. These recording engine monitors sure make it easy to test a new plane. You can concentrate on working the problem without worrying about recording which cylinder was the highest or lowest or whatever the issue may be.
Biggest lesson learned here is that for future early flights only critical items will have warnings enabled. Today I went along with a friend for moral support on his first flight in his new (to him) Searey Amphibian after a year of repairs and improvements. The previous owner thoughtfully included a switch for turning on or off the audio warnings from the engine monitor. I turned it off for takeoff and sure enough, the bloody thing lit up like Apollo 12 but my buddy climbed straight ahead ignoring everything while I cancelled one spurious warning after another. Not sure he would have been able to be so disciplined if it had been yelling in our ears.
Sebastien
On Sep 24, 2017, at 09:57, Robert L. Nuckolls, III <nuckolls.bob(at)aeroelectric.com (nuckolls.bob(at)aeroelectric.com)> wrote:
| Quote: | At 06:09 PM 9/23/2017, you wrote:
| Quote: | I am doing the test flying on a friend's RV-6 and as part of the preparation I set up the engine monitor (Dynon 120) to display the following on the voltmeter and ammater:
Voltmeter: Red below 10V, Yellow 10-13.8V, Green 13.8V-14.5V, Red > 14.5V
Ammeter (wired to show current flow in to the batter): Red < 0A, Green 0 - 5A, Yellow 5-30A, Red > 30A. |
Assuming you do monitor bus voltage and have
active notification of low voltage, then there
is no operational value for monitoring battery
current.
Battery ammeters in airplanes were a carry-over
from the terrestrial vehicles where the minus-zero-plus
instrument in the battery charge/discharge line
was the simplest single monitor of system health
during normal vehicle operations.
The ammeter would be expected to show a heavy
recharge rate right after cranking the engine . . .
or after a jumper cable start on a dead battery.
After some interval of normal operation, the battery
accepts less and less recharge energy and the needle
migrates toward zero. Under normal ops (votlage about
right, battery charged) the needle would rest at or
just slightly above zero.
If generator output was insufficient (low engine rpm,
high system loads, regulator voltage drifting downward,
generator failing) the needle would present some
value below zero.
While truly an analog instrument, its BEHAVIOR was
closer to 'digital' in that it was never intended to
be READ so much as observed as a go/no-go panel
instrument.
Ammeters of all types are of little to no value as sources of
operational data in flight. Ammeters in the battery
lead are pretty much useless when compared to an accurate
voltmeter paired with active notification of low
voltage.
Calibrating a battery ammeter with alarm settings
will be an exercise in futility.
Suggest you move the ammeter sensor to the alternator
b-lead and eliminate any alarm functions from this
reading. The ammeter is most useful as a maintenance
tool for diagnosing why the VOLTAGE is low and/or
the LOW VOLTS warning light was illuminated in the
air.
Bob . . .
|
| | - The Matronics AeroElectric-List Email Forum - | | | Use the List Feature Navigator to browse the many List utilities available such as the Email Subscriptions page, Archive Search & Download, 7-Day Browse, Chat, FAQ, Photoshare, and much more:
http://www.matronics.com/Navigator?AeroElectric-List |
|
|
|
| Back to top |
|
 |
nuckolls.bob(at)aeroelect
Guest
|
 Posted: Thu Oct 05, 2017 9:06 am Post subject: Voltmeter & Ammeter normal ranges Posted: Thu Oct 05, 2017 9:06 am Post subject: Voltmeter & Ammeter normal ranges |
 |
|
At 08:32 AM 9/24/2017, you wrote:
| Quote: | | Exactly. Joe could you please confirm that the jpeg below is visible? If so it's obvious that while the voltage seems to be moving around a tiny bit, it never gets to the point which would allow the amperage shown. It's always above 14V. Also I checked some data with the engine shut down and while the amperage still wanders around it's 1 A or less (-5.5 to -6.5 A) |
Digital data acquisition is fraught with
opportunity for confusion/error. Depending
on how the variable is sampled, pre-filtered
and software filtered, data displayed or plotted
can take on the appearance of instability.
Unless you're measuring the output from something
like a battery . . . or a laboratory power supply,
the stimulus being observed will have some noise
on it. This is especially true of signals gathered
from the DC power system of any vehicle.
When I'm gathering data on relatively low frequency
events, my DAS pre-filtering is usually rolled
off at 10 Hz. Then interpretation software is
designed to do a 'rolling average' on sampled values.
For a DAS set up to gather 100 samples/second, we'll
buffer 16 samples in a memory stack, take the sum
of those values then divide by 16 for an average
of that 'packet' of data. When the next sample comes
in, we add the new value, throw away the oldest value
and do the average again.
This pre/post processing of data does a nice job
of ignoring the high frequency perturbations that
are riding on top of the value of interest. The
processed data plots are nice smooth lines that
are more meaningful.
I suspect that data plots taken from most
EIS systems have little pre-processing and no
post processing . . . so the traces are understandably
'ragged'. So while the voltage traces might
be interpreted as 'unstable', it's probable
that the system is operating normally.
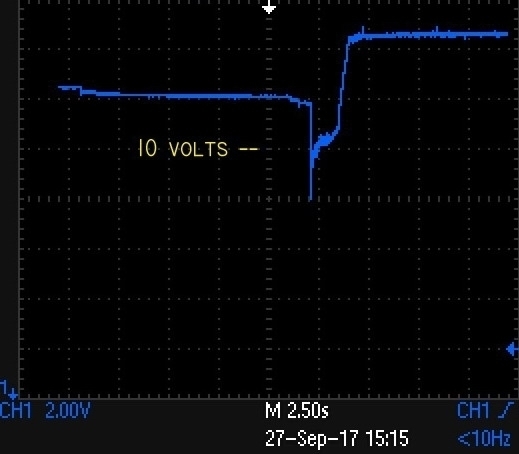
Just for grins, I took the 'scope out to peek at
the 14v bus in Dr. Dee's '87 GMC Sierra. With
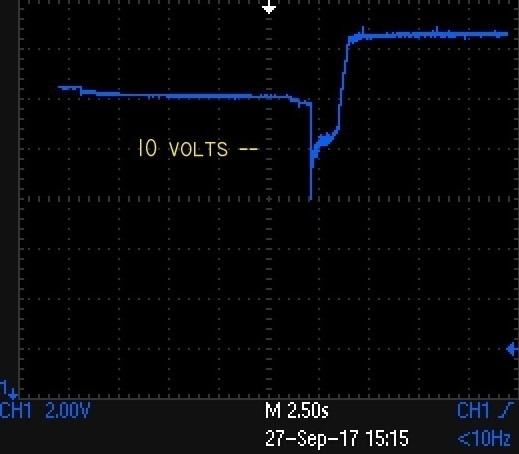
the 'scope set to 2.5S/div H and 2V/div V, we
get the following trace when cranking the engine.
[img]cid:.0[/img]
Figure 1.
Note that battery voltage starts to sag from
about 12.8 volts but takes a steeper slope
as the starter contactor is energized followed
by a profound drop to 8 volts as the contactor
closes. A few milliseconds later, the voltage
rises to about 10v until the engine catches
approx 1.2S later and the alternator kicks
in . . . whereupon but bus rises to about
14.6V
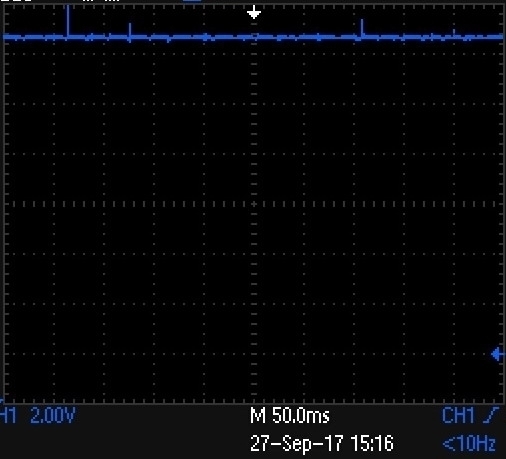
[img]cid:.1[/img]
Figure 2.
In the next plot we see that the bus is 'steady'
at about 14.7V with the occasional perturbation
combined with some little 'spikes' with an amplitude
of 1 to 2 volts.
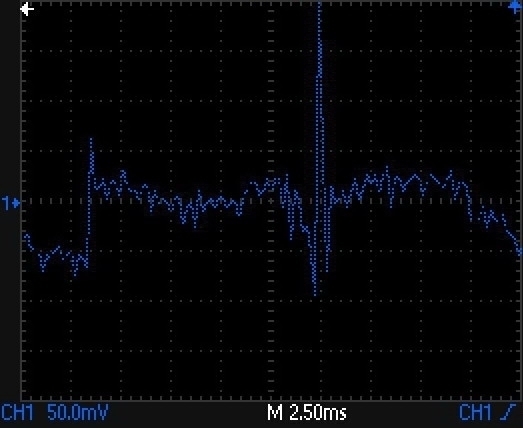
To get a closer look at the voltage in the
next plot, we need to turn up the 'scope sensitivity
and to to AC coupling:
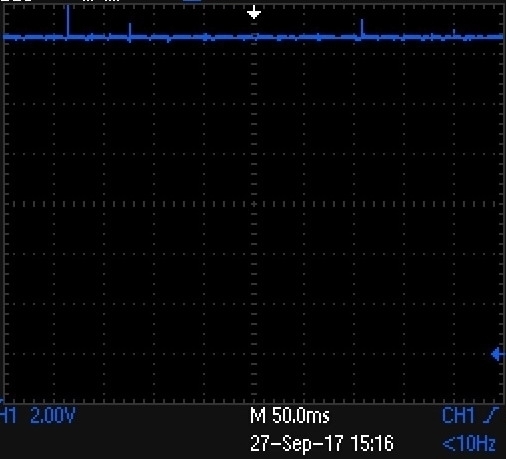
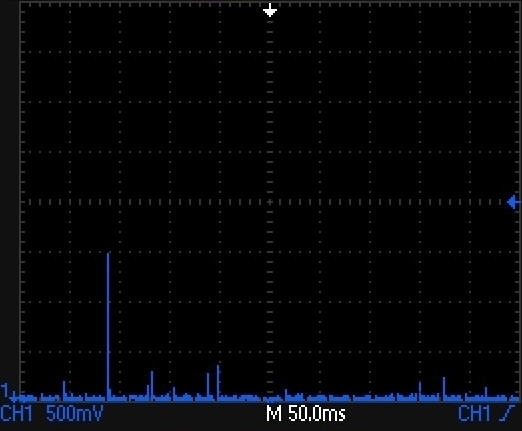
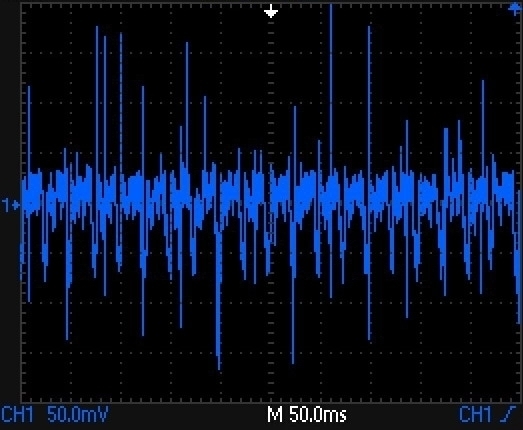
[img]cid:.2[/img]
Figure 3.
With a vertical scale of 0.5V/div and horizontal
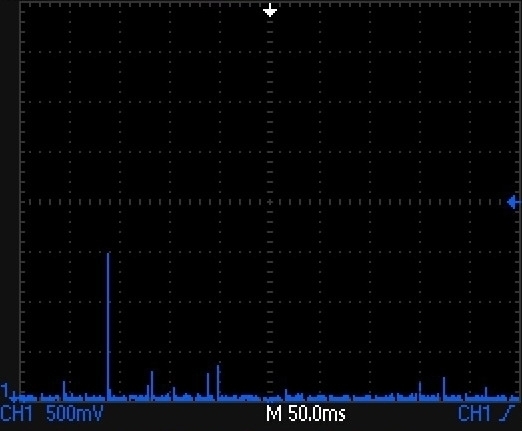
of 0.05S/div we can get a better look at the 'noise'.
This particular trace caught a 1.5v transient amongst
about 10 smaller artifacts.
We see that even when there are no obvious
transients, the horizontal line has 'thickness'.
Zooming in closer:
[img]cid:.3[/img]
Figure 4.
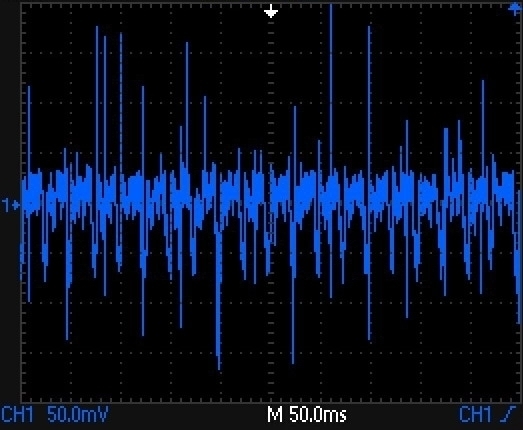
We find that the horizontal line is 'fuzzy' with
positive and negative going transients on the
order of 300mV peak.
Depending on where your digital data acquistion
system takese a 'snapshot', the sampled votlage
might appear to 'wobble' by as much as +/-0.5V.
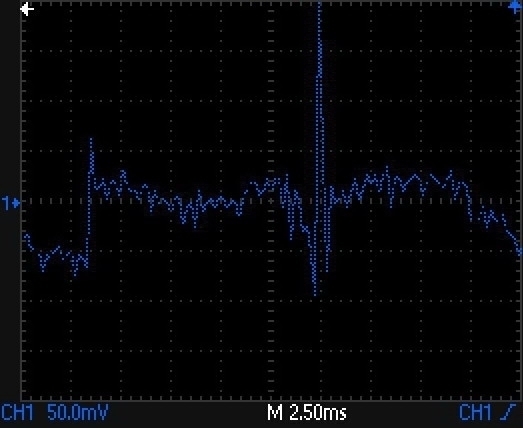
Spreading out the major transients by a factor
of 20 . . .
[img]cid:.4[/img]
Figure 5.
Shows that they're about 400 microSeconds wide. These
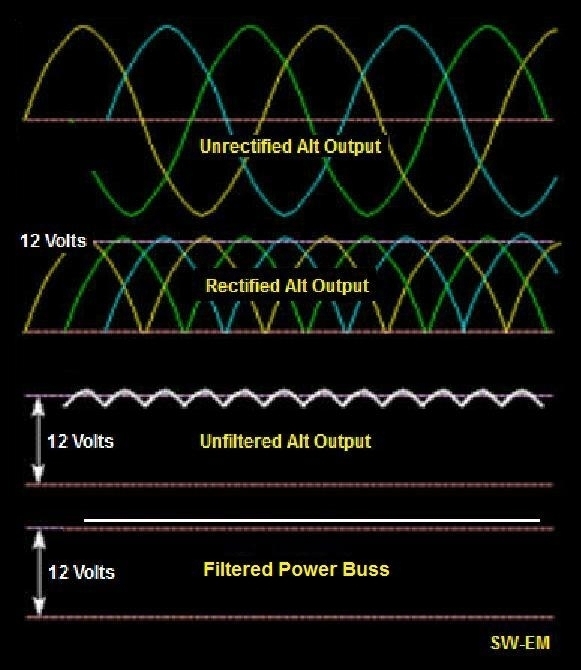
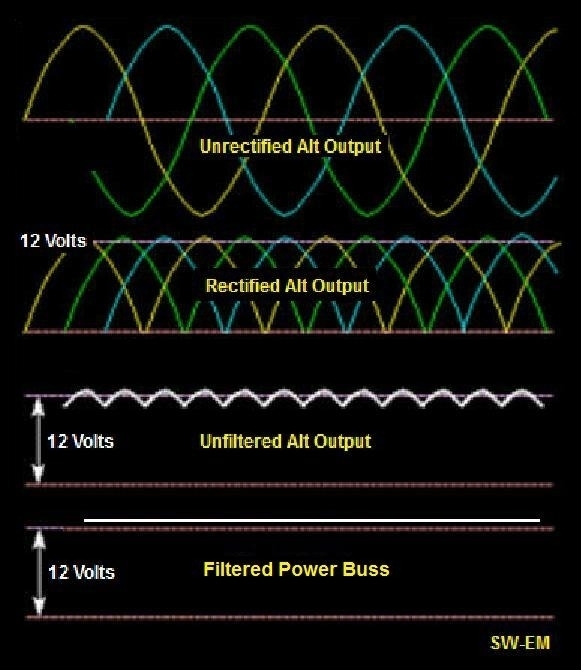
plots offer a small peek into the nature of DC power
systems on vehicles. A few weeks ago, a thread on
another list server offered this image suggesting
that the full-wave, rectified 3-phase alternator
would produce wave forms something along these lines . . .
[img]cid:.5[/img]
Figure 6.
Theoretically true, but I've never seen so 'clean'
a picture in the wild . . .
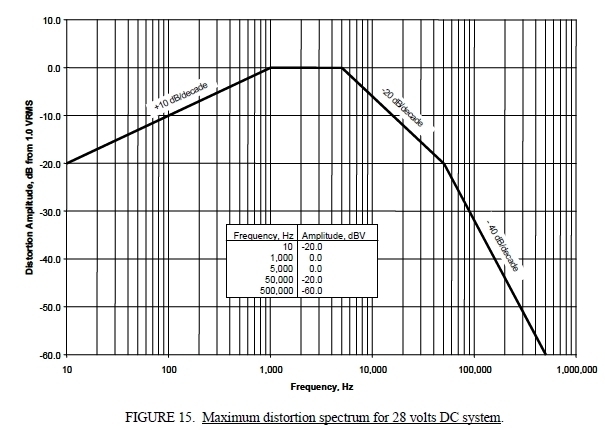
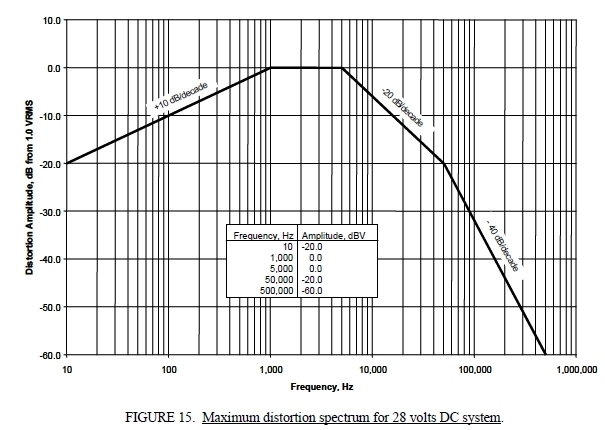
Referring to Mil-Std-704 we learn that DC power systems
demonstrate a certain amount of noise (distortion)
under normal conditions. The document cites
the following plot for a 28v system (cut the
numbers in half for 14 volts).
[img]cid:.6[/img]
Figure 7.
Over the range of 1000 Hz (1 milliSecond period) and
10,000 Hz (100 uSecond), we should expect artifacts
of noise up to 0.5 VRMS (1.5 volts pk-pk) on a 14V bus.
Above and below those frequencies, the allowable/exoected
noise levels fall off. When you hook an oscilloscope to
the bus, the best you can do is sample small features
of the noise as illustrated in the first 5 figures. Further,
you'll never see the pristine plots hypothesized in Figure 6.
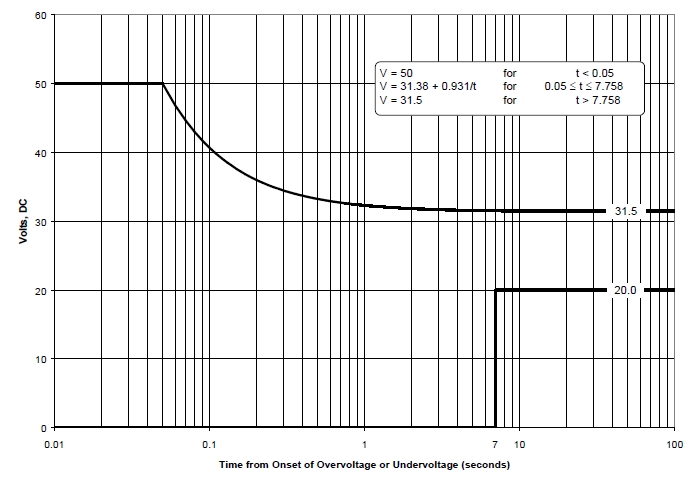
[img]cid:.7[/img]
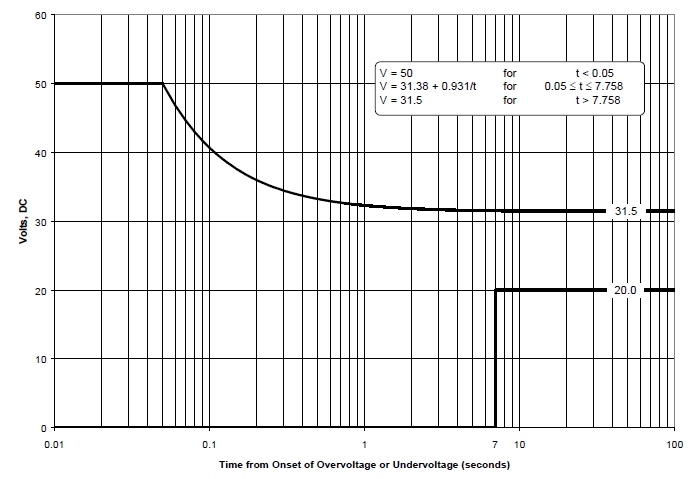
Figure 8.
The most significant attribute of a DC power system is VOLTAGE.
Referring again to Mil-STD-704 we find the plot above. Again,
cut the voltage levels in half for a 14v system.
This figure suggests that any voltage vs. time condition
below the upper trace . . . and above the lower trace . . .
is a condition to be expected for designing and operating
appliances powered from the DC system.
It's my wish that this narrative will give you some tools
for critical review of any data presented by either operating
or diagnostic instruments. Understanding characteristics
signals present on the bus -AND- limits on the measuring
instrument will go to better design, operation and diagnosis
of your ship's DC power system.
Bob . . .
| | - The Matronics AeroElectric-List Email Forum - | | | Use the List Feature Navigator to browse the many List utilities available such as the Email Subscriptions page, Archive Search & Download, 7-Day Browse, Chat, FAQ, Photoshare, and much more:
http://www.matronics.com/Navigator?AeroElectric-List |
|
| Description: |
|
| Filesize: |
78.43 KB |
| Viewed: |
15405 Time(s) |
|
| Description: |
|
| Filesize: |
88.53 KB |
| Viewed: |
15405 Time(s) |
|
| Description: |
|
| Filesize: |
80.54 KB |
| Viewed: |
15405 Time(s) |
|
| Description: |
|
| Filesize: |
113.61 KB |
| Viewed: |
15405 Time(s) |
|
| Description: |
|
| Filesize: |
82.56 KB |
| Viewed: |
15405 Time(s) |
|
| Description: |
|
| Filesize: |
167.31 KB |
| Viewed: |
15405 Time(s) |
|
| Description: |
|
| Filesize: |
113.85 KB |
| Viewed: |
15405 Time(s) |
|
| Description: |
|
| Filesize: |
109.17 KB |
| Viewed: |
15405 Time(s) |
|
|
|
| Back to top |
|
 |
bob.verwey(at)gmail.com
Guest
|
 Posted: Thu Oct 05, 2017 9:05 pm Post subject: Voltmeter & Ammeter normal ranges Posted: Thu Oct 05, 2017 9:05 pm Post subject: Voltmeter & Ammeter normal ranges |
 |
|
Absolutely facinating and insightful to a neophyte like myself <grin>
On 05 Oct 2017 7:17 PM, "Robert L. Nuckolls, III" <nuckolls.bob(at)aeroelectric.com (nuckolls.bob(at)aeroelectric.com)> wrote: | Quote: | At 08:32 AM 9/24/2017, you wrote:
| Quote: | | Exactly. Joe could you please confirm that the jpeg below is visible? If so it's obvious that while the voltage seems to be moving around a tiny bit, it never gets to the point which would allow the amperage shown. It's always above 14V. Also I checked some data with the engine shut down and while the amperage still wanders around it's 1 A or less (-5.5 to -6.5 A) |
Digital data acquisition is fraught with
opportunity for confusion/error. Depending
on how the variable is sampled, pre-filtered
and software filtered, data displayed or plotted
can take on the appearance of instability.
Unless you're measuring the output from something
like a battery . . . or a laboratory power supply,
the stimulus being observed will have some noise
on it. This is especially true of signals gathered
from the DC power system of any vehicle.
When I'm gathering data on relatively low frequency
events, my DAS pre-filtering is usually rolled
off at 10 Hz. Then interpretation software is
designed to do a 'rolling average' on sampled values.
For a DAS set up to gather 100 samples/second, we'll
buffer 16 samples in a memory stack, take the sum
of those values then divide by 16 for an average
of that 'packet' of data. When the next sample comes
in, we add the new value, throw away the oldest value
and do the average again.
This pre/post processing of data does a nice job
of ignoring the high frequency perturbations that
are riding on top of the value of interest. The
processed data plots are nice smooth lines that
are more meaningful.
I suspect that data plots taken from most
EIS systems have little pre-processing and no
post processing . . . so the traces are understandably
'ragged'. So while the voltage traces might
be interpreted as 'unstable', it's probable
that the system is operating normally.
Just for grins, I took the 'scope out to peek at
the 14v bus in Dr. Dee's '87 GMC Sierra. With
the 'scope set to 2.5S/div H and 2V/div V, we
get the following trace when cranking the engine.
[img]cid:.0[/img]
Figure 1.
Note that battery voltage starts to sag from
about 12.8 volts but takes a steeper slope
as the starter contactor is energized followed
by a profound drop to 8 volts as the contactor
closes. A few milliseconds later, the voltage
rises to about 10v until the engine catches
approx 1.2S later and the alternator kicks
in . . . whereupon but bus rises to about
14.6V
[img]cid:.1[/img]
Figure 2.
In the next plot we see that the bus is 'steady'
at about 14.7V with the occasional perturbation
combined with some little 'spikes' with an amplitude
of 1 to 2 volts.
To get a closer look at the voltage in the
next plot, we need to turn up the 'scope sensitivity
and to to AC coupling:
[img]cid:.2[/img]
Figure 3.
With a vertical scale of 0.5V/div and horizontal
of 0.05S/div we can get a better look at the 'noise'.
This particular trace caught a 1.5v transient amongst
about 10 smaller artifacts.
We see that even when there are no obvious
transients, the horizontal line has 'thickness'.
Zooming in closer:
[img]cid:.3[/img]
Figure 4.
We find that the horizontal line is 'fuzzy' with
positive and negative going transients on the
order of 300mV peak.
Depending on where your digital data acquistion
system takese a 'snapshot', the sampled votlage
might appear to 'wobble' by as much as +/-0.5V.
Spreading out the major transients by a factor
of 20 . . .
[img]cid:.4[/img]
Figure 5.
Shows that they're about 400 microSeconds wide. These
plots offer a small peek into the nature of DC power
systems on vehicles. A few weeks ago, a thread on
another list server offered this image suggesting
that the full-wave, rectified 3-phase alternator
would produce wave forms something along these lines . . .
[img]cid:.5[/img]
Figure 6.
Theoretically true, but I've never seen so 'clean'
a picture in the wild . . .
Referring to Mil-Std-704 we learn that DC power systems
demonstrate a certain amount of noise (distortion)
under normal conditions. The document cites
the following plot for a 28v system (cut the
numbers in half for 14 volts).
[img]cid:.6[/img]
Figure 7.
Over the range of 1000 Hz (1 milliSecond period) and
10,000 Hz (100 uSecond), we should expect artifacts
of noise up to 0.5 VRMS (1.5 volts pk-pk) on a 14V bus.
Above and below those frequencies, the allowable/exoected
noise levels fall off. When you hook an oscilloscope to
the bus, the best you can do is sample small features
of the noise as illustrated in the first 5 figures. Further,
you'll never see the pristine plots hypothesized in Figure 6.
[img]cid:.7[/img]
Figure 8.
The most significant attribute of a DC power system is VOLTAGE.
Referring again to Mil-STD-704 we find the plot above. Again,
cut the voltage levels in half for a 14v system.
This figure suggests that any voltage vs. time condition
below the upper trace . . . and above the lower trace . . .
is a condition to be expected for designing and operating
appliances powered from the DC system.
It's my wish that this narrative will give you some tools
for critical review of any data presented by either operating
or diagnostic instruments. Understanding characteristics
signals present on the bus -AND- limits on the measuring
instrument will go to better design, operation and diagnosis
of your ship's DC power system.
Bob . . .
|
| | - The Matronics AeroElectric-List Email Forum - | | | Use the List Feature Navigator to browse the many List utilities available such as the Email Subscriptions page, Archive Search & Download, 7-Day Browse, Chat, FAQ, Photoshare, and much more:
http://www.matronics.com/Navigator?AeroElectric-List |
|
| Description: |
|
| Filesize: |
80.54 KB |
| Viewed: |
15400 Time(s) |
|
| Description: |
|
| Filesize: |
88.53 KB |
| Viewed: |
15400 Time(s) |
|
| Description: |
|
| Filesize: |
82.56 KB |
| Viewed: |
15400 Time(s) |
|
| Description: |
|
| Filesize: |
113.85 KB |
| Viewed: |
15400 Time(s) |
|
| Description: |
|
| Filesize: |
167.31 KB |
| Viewed: |
15400 Time(s) |
|
| Description: |
|
| Filesize: |
78.43 KB |
| Viewed: |
15400 Time(s) |
|
| Description: |
|
| Filesize: |
109.17 KB |
| Viewed: |
15400 Time(s) |
|
| Description: |
|
| Filesize: |
113.61 KB |
| Viewed: |
15400 Time(s) |
|
|
|
| Back to top |
|
 |
cluros(at)gmail.com
Guest
|
 Posted: Fri Oct 06, 2017 10:36 am Post subject: Voltmeter & Ammeter normal ranges Posted: Fri Oct 06, 2017 10:36 am Post subject: Voltmeter & Ammeter normal ranges |
 |
|
Thank you Bob. Very good information and well presented. I'm looking forward to learning more about the capabilities and limits of these instruments.
On Thu, Oct 5, 2017 at 10:03 PM, Bob Verwey <bob.verwey(at)gmail.com (bob.verwey(at)gmail.com)> wrote:
| Quote: | Absolutely facinating and insightful to a neophyte like myself <grin>
On 05 Oct 2017 7:17 PM, "Robert L. Nuckolls, III" <nuckolls.bob(at)aeroelectric.com (nuckolls.bob(at)aeroelectric.com)> wrote: | Quote: | At 08:32 AM 9/24/2017, you wrote:
| Quote: | | Exactly. Joe could you please confirm that the jpeg below is visible? If so it's obvious that while the voltage seems to be moving around a tiny bit, it never gets to the point which would allow the amperage shown. It's always above 14V. Also I checked some data with the engine shut down and while the amperage still wanders around it's 1 A or less (-5.5 to -6.5 A) |
Digital data acquisition is fraught with
opportunity for confusion/error. Depending
on how the variable is sampled, pre-filtered
and software filtered, data displayed or plotted
can take on the appearance of instability.
Unless you're measuring the output from something
like a battery . . . or a laboratory power supply,
the stimulus being observed will have some noise
on it. This is especially true of signals gathered
from the DC power system of any vehicle.
When I'm gathering data on relatively low frequency
events, my DAS pre-filtering is usually rolled
off at 10 Hz. Then interpretation software is
designed to do a 'rolling average' on sampled values.
For a DAS set up to gather 100 samples/second, we'll
buffer 16 samples in a memory stack, take the sum
of those values then divide by 16 for an average
of that 'packet' of data. When the next sample comes
in, we add the new value, throw away the oldest value
and do the average again.
This pre/post processing of data does a nice job
of ignoring the high frequency perturbations that
are riding on top of the value of interest. The
processed data plots are nice smooth lines that
are more meaningful.
I suspect that data plots taken from most
EIS systems have little pre-processing and no
post processing . . . so the traces are understandably
'ragged'. So while the voltage traces might
be interpreted as 'unstable', it's probable
that the system is operating normally.
Just for grins, I took the 'scope out to peek at
the 14v bus in Dr. Dee's '87 GMC Sierra. With
the 'scope set to 2.5S/div H and 2V/div V, we
get the following trace when cranking the engine.
[img]cid:.0[/img]
Figure 1.
Note that battery voltage starts to sag from
about 12.8 volts but takes a steeper slope
as the starter contactor is energized followed
by a profound drop to 8 volts as the contactor
closes. A few milliseconds later, the voltage
rises to about 10v until the engine catches
approx 1.2S later and the alternator kicks
in . . . whereupon but bus rises to about
14.6V
[img]cid:.1[/img]
Figure 2.
In the next plot we see that the bus is 'steady'
at about 14.7V with the occasional perturbation
combined with some little 'spikes' with an amplitude
of 1 to 2 volts.
To get a closer look at the voltage in the
next plot, we need to turn up the 'scope sensitivity
and to to AC coupling:
[img]cid:.2[/img]
Figure 3.
With a vertical scale of 0.5V/div and horizontal
of 0.05S/div we can get a better look at the 'noise'.
This particular trace caught a 1.5v transient amongst
about 10 smaller artifacts.
We see that even when there are no obvious
transients, the horizontal line has 'thickness'.
Zooming in closer:
[img]cid:.3[/img]
Figure 4.
We find that the horizontal line is 'fuzzy' with
positive and negative going transients on the
order of 300mV peak.
Depending on where your digital data acquistion
system takese a 'snapshot', the sampled votlage
might appear to 'wobble' by as much as +/-0.5V.
Spreading out the major transients by a factor
of 20 . . .
[img]cid:.4[/img]
Figure 5.
Shows that they're about 400 microSeconds wide. These
plots offer a small peek into the nature of DC power
systems on vehicles. A few weeks ago, a thread on
another list server offered this image suggesting
that the full-wave, rectified 3-phase alternator
would produce wave forms something along these lines . . .
[img]cid:.5[/img]
Figure 6.
Theoretically true, but I've never seen so 'clean'
a picture in the wild . . .
Referring to Mil-Std-704 we learn that DC power systems
demonstrate a certain amount of noise (distortion)
under normal conditions. The document cites
the following plot for a 28v system (cut the
numbers in half for 14 volts).
[img]cid:.6[/img]
Figure 7.
Over the range of 1000 Hz (1 milliSecond period) and
10,000 Hz (100 uSecond), we should expect artifacts
of noise up to 0.5 VRMS (1.5 volts pk-pk) on a 14V bus.
Above and below those frequencies, the allowable/exoected
noise levels fall off. When you hook an oscilloscope to
the bus, the best you can do is sample small features
of the noise as illustrated in the first 5 figures. Further,
you'll never see the pristine plots hypothesized in Figure 6.
[img]cid:.7[/img]
Figure 8.
The most significant attribute of a DC power system is VOLTAGE.
Referring again to Mil-STD-704 we find the plot above. Again,
cut the voltage levels in half for a 14v system.
This figure suggests that any voltage vs. time condition
below the upper trace . . . and above the lower trace . . .
is a condition to be expected for designing and operating
appliances powered from the DC system.
It's my wish that this narrative will give you some tools
for critical review of any data presented by either operating
or diagnostic instruments. Understanding characteristics
signals present on the bus -AND- limits on the measuring
instrument will go to better design, operation and diagnosis
of your ship's DC power system.
Bob . . .
|
|
| | - The Matronics AeroElectric-List Email Forum - | | | Use the List Feature Navigator to browse the many List utilities available such as the Email Subscriptions page, Archive Search & Download, 7-Day Browse, Chat, FAQ, Photoshare, and much more:
http://www.matronics.com/Navigator?AeroElectric-List |
|
|
|
| Back to top |
|
 |
|
|
You cannot post new topics in this forum
You cannot reply to topics in this forum
You cannot edit your posts in this forum
You cannot delete your posts in this forum
You cannot vote in polls in this forum
You cannot attach files in this forum
You can download files in this forum
|
Powered by phpBB © 2001, 2005 phpBB Group
|


